
Jun Station 준스테이션
Pearson 및 Spearman 상관 방법의 비교 본문
[참고 사이트]
Pearson 및 Spearman 상관 방법의 비교 - Minitab
support.minitab.com
Pearson 곱적률 상관
- Pearson 상관은 두 계량형 변수 사이의 선형 관계 평가
- 한 변수의 변화가 다른 변수의 변화에 비례적으로 연관되어 있는 경우 선형 관계
- 계량형 변수란?
- 계량형 변수는 두 값 사이에 무한한 개수의 값이 있는 숫자 변수. 숫자 또는 날짜/시간.
- 예: 부품 길이, 대금이 결제되는 날자 및 시간
- https://docs.scipy.org/doc/scipy/reference/generated/scipy.stats.pearsonr.html
scipy.stats.pearsonr — SciPy v1.7.1 Manual
Student, “Probable error of a correlation coefficient”, Biometrika, Volume 6, Issue 2-3, 1 September 1908, pp. 302-310.
docs.scipy.org
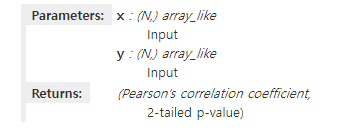
Input:
Returns:
1). Pearson correlation coefficient, it measures the linear relationship between two datasets.
Pearson’s correlation requires that each dataset be normally distributed. Like other correlation coefficients, this one varies between -1 and +1 with 0 implying no correlation. Correlations of -1 or +1 imply an exact linear relationship. Positive correlations imply that as x increases, so does y. Negative correlations imply that as x increases, y decreases.
2). The p-value roughly indicates the probability of an uncorrelated system producing datasets that have a Pearson correlation at least as extreme as the one computed from these datasets. The p-values are not entirely reliable but are probably reasonable for datasets larger than 500 or so.
Spearman 순위 상관
- 두 계량형 변수 또는 순서형 변수 사이의 단순 관계 평가
- 단순 관계에서 두 변수는 함께 변화하는 경향이 있으나, 반드시 일정한 비율로 변화하는 것은 아님
- 원시 데이터가 아닌 각 변수에 대해 순위를 매긴 값을 기반으로 함
- 종종 순서형 변수가 포함된 관계를 평가하기 위해 사용
- https://docs.scipy.org/doc/scipy/reference/generated/scipy.stats.spearmanr.html
scipy.stats.spearmanr — SciPy v1.7.1 Manual
If axis=0 (default), then each column represents a variable, with observations in the rows. If axis=1, the relationship is transposed: each row represents a variable, while the columns contain observations. If axis=None, then both arrays will be raveled.
docs.scipy.org

Returns:
1). Spearman correlation coefficient, the Spearman correlation is a nonparametric measure of the monotonicity of the relationship between two datasets. Unlike the Pearson correlation, the Spearman correlation does not assume that both datasets are normally distributed. Like other correlation coefficients, this one varies between -1 and +1 with 0 implying no correlation. Correlations of -1 or +1 imply an exact monotonic relationship. Positive correlations imply that as x increases, so does y. Negative correlations imply that as x increases, y decreases.
2). The p-value roughly indicates the probability of an uncorrelated system producing datasets that have a Spearman correlation at least as extreme as the one computed from these datasets. The p-values are not entirely reliable but are probably reasonable for datasets larger than 500 or so.